Week 1 Principles of Economics - Microeconomics

Supply, Demand, and Equilibrium
Demand curve
Graphs quantity demanded at various price points. Quantity demanded decreases if price increases, as less consumers are willing to purchase the product.
Supply curve
Graphs quantity supplied at various price points. Quantity supplied increases if price increases, as more suppliers are willing to supply the product.
How to interpret supply and demand curve?
- If price of a product decreases, consumers who were buying products which are substitutes, are now buying the product.
- If price of a product increases, suppliers who were making other products, are now supplying the product.
Supply and demand equilibrium price point.
- When supply and demand are graphed, equilibrium is where these intersect.
- In a free market, market forces are always trying to push the price towards equilibrium.
- If price is above equilibrium, there is product surplus as demand < supply. This pushes the price down, towards equilibrium.
- If price is below equilibrium, there is product shortage as demand > supply. This pushes the price up, towards the equilibrium.
At equilibrium, total gains from the trade are maximized.
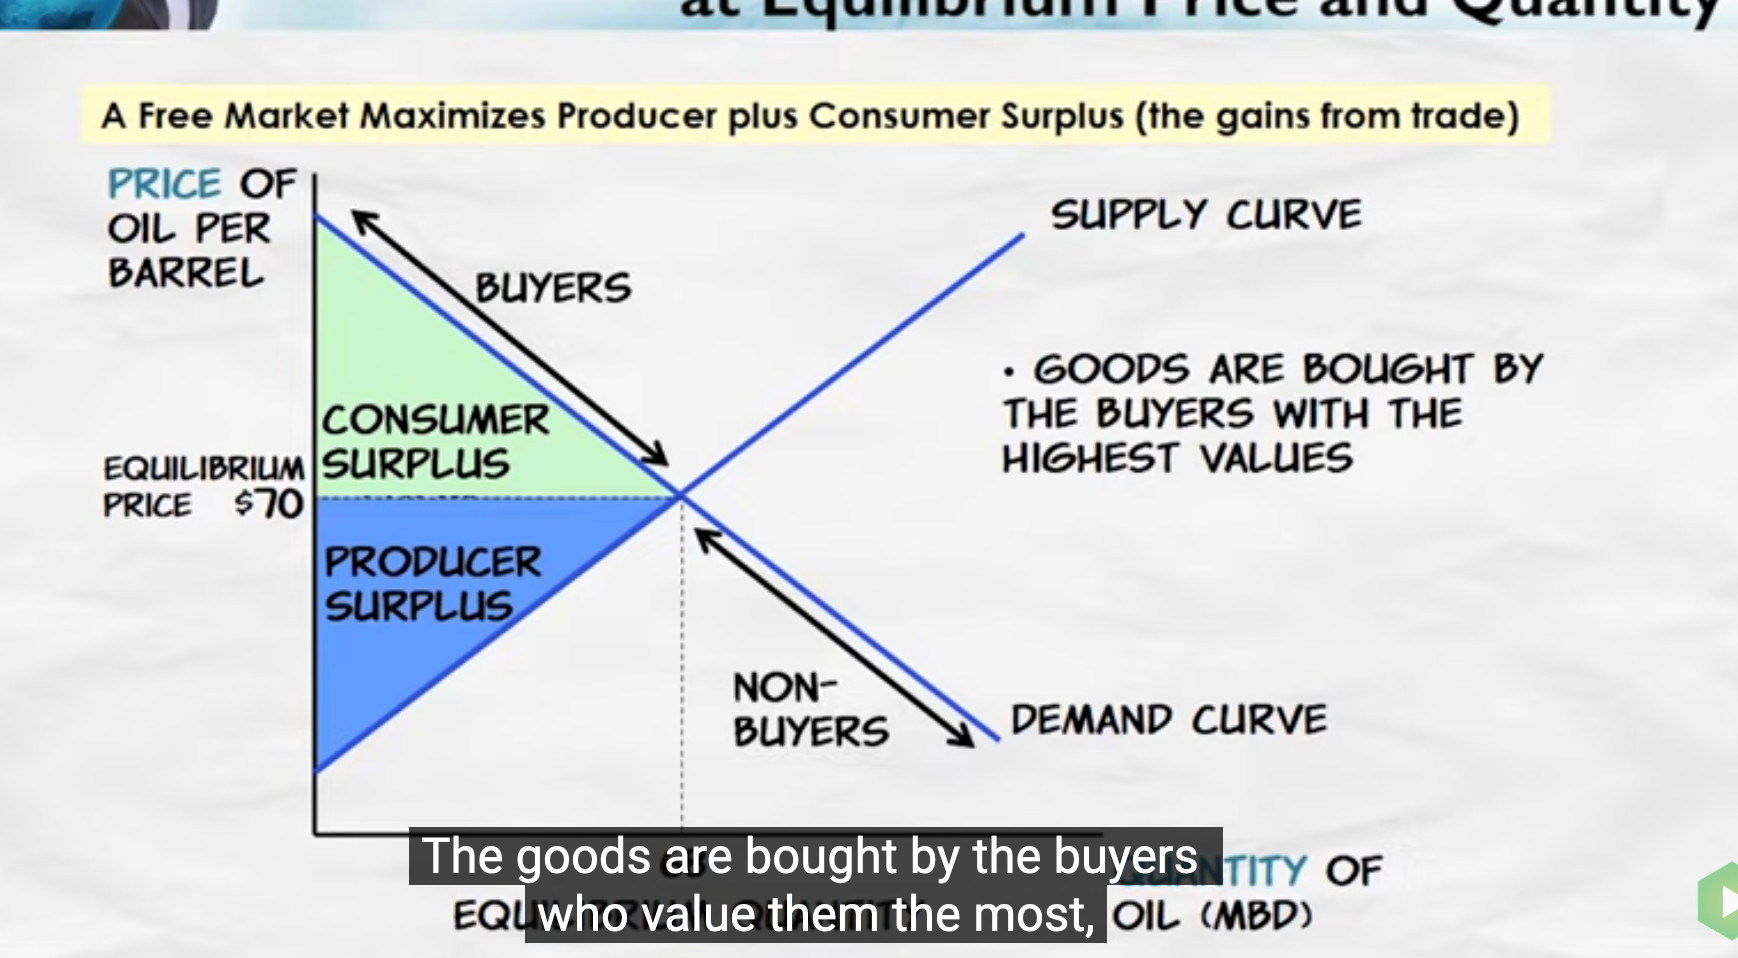
Consumer surplus
- It is profit made by consumer.
- It is the difference between a maximum price a consumer is willing to pay and purchase price.
Producer surplus
- It is profit made by supplier.
- It is the difference between minimum price a supplier willing to sell at and sale price.
- Assuming that minimum price set by supplier includes some profit margin, this is the extra profit made by supplier.
Demand curve shifts
- demand curve shifts right - greater quantity demanded at every given price point.
- demand curve shifts left - lesser quantity demanded at every given price point.
Possible reasons
- Income
- Population
- Price of substitutes
- Price of complements
- Expectations
- Tastes
Income
- For normal goods demand increases if income increases. e.g computers, phones, pubs.
- For inferior goods demand decreases if income decreases. e.g fast food.
Population
- Demand curve shifts with changes in population.
Price of substitutes
- Two goods are substitutes if increase in price for one good leads to an increase in demand for the other good. demand(good1) ∝ price(good2)
Price of complements
- Two goods are complements if an increase in the price of one good leads to an decrease in the demand for the other.
- Fuel and cars are complements. If fuel price increases, demand for cars will decrease.
Expectations
- Future price of a good will shift demand curve for the good right now.
Tastes
- Seasonal goods, fashion, fads.
- Remember pet rock!
Supply curve shifts
- Supply curve shifts left - quantity supplied at every given price decreases.
- Supply curve shifts right - quantity supplied at every given price increases.
Possible reasons
- Technological innovations - can drive down prices and/or increase throughput without adding much more cost increase supply.
- Input prices - Cost of raw materials, labour, and other input resources may affect price and supply.
- Tax and subsidies - Additional taxes will drive up prices and shift supply curve up. Subsidies will drive down prices and will shift supply curve down.
- Expectations - Future demand and prices will affect current supply.
- Opportunity costs - If another market has shifted providing better opportunities for supplier, that will increase cost and will shift supply curve.
Equilibrium
Free market maximizes gain from trade at equilibrium quantity and prices.
Does equilibrium work? Absolutely yes!